Thing 19: Mapping tools
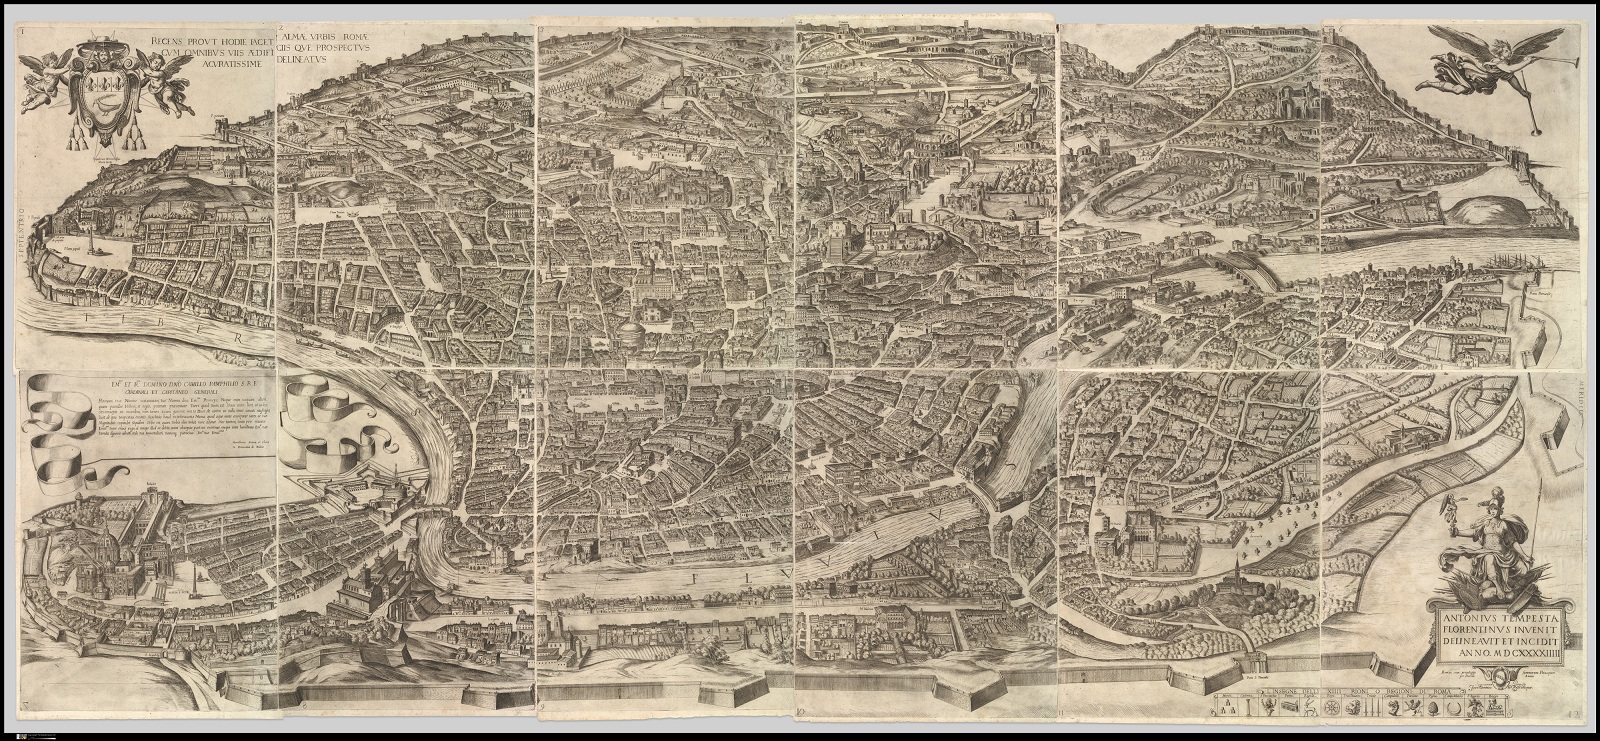
Metropolitan Museum of Art, New York.
We’re down to the final five with Thing 19 of 23 Research Things and this week we look at a great range of different mapping tools that can be used to visualise your research data. Thing 19 was written by Andrea Hurt (Client Services & Liaison Librarian, Arts), Ben Kreunen (University Digitisation Centre), Jane Beattie (University of Melbourne Archives) and Steve Bennett (Information Technology Services).
Getting started
Mapping and geographic information systems (GIS) provide a way to visualise and contextualise complex data. There is a wide range of software available that researchers can use to display and share their research data via blogs, Google Earth & Maps and social media. Whether you’re uploading information from spreadsheets to show geographical distribution or overlaying historical photos on streetview maps, visualising information can help make complex data more easily understood. Many of the sites we’ll discuss here are also useful as research tools themselves, and some enable you to contribute information yourself and add to an ever-expanding knowledge-base.
Geotagging
Geotagging is the process of assigning the geographic coordinates of a camera’s location at the time an image was created (i.e., placing the camera on a map).
How
Many newer cameras and smart phones will have GPS incorporated in their software. If not, you may need to connect a separate GPS device. In that case, record a log of your position and time when taking photographs. Applications (listed below) can then use the GPS log to embed the position into the image metadata. Alternatively, you can do this manually once you’ve located the image position on a map.
Most photo-sharing sites will automatically place images on a map based on any metadata embedded in the image.
Free Tools
- GeoImgr (online)
- Geosetter (Win)
- GPSLinker (Mac) syncing from GPS tracks, Pro version includes map interaction
- GeoTag (Mac)
- Microsoft Pro Photo Tools version 2
- EXIFTool (for those who like to roll their own)
Things to explore
Georeferencing
Georeferencing is the process of assigning geographic coordinates to features within an image (i.e., making a map from an image). This allows you to compare directly maps, aerial photography and satellite imagery with other geographical data making it a very effective tool for tracking changes in locations over time.

How
Georeferencing is a bit more complicated than geotagging and requires additional information for a single image. A number of applications can facilitate the process, while the complexity of the task depends on the accuracy required.
Google Earth provides a simple way to overlay images above satellite imagery and maps. By adjusting the transparency of the image, you can see the underlying map enabling you to manually move, scale and rotate the image until they are aligned. Staff can install Google Earth via the Symantec Software Portal on their computer.
More complex geographical information systems (GIS), such as QGIS, ARCGIS and Global Mapper include georeferencing tools as part of their functionality. ARCGIS is available through University Licensing and on some computers on campus.
Tools to try
- Google Earth
- Georeferencer
- Agisoft Photoscan Pro (Stitch multiple aerial photos to high resolution maps) Demo and education pricing available.
Things to explore:
- The University Digitisation Centre has done work in Google Earth:
- Old Maps Online
- Video, UAV-based vegetation mapping
- Video, ARCGIS georeferencing tutorial:
Historypin
Historypin aims to build an understanding of the world through user-generated content. It’s both desktop and App-based. Using geotagging with Google maps, users can ‘pin’ photographs to a map, and add contextual information such as a title, description, date, creator and any copyright conditions. Once the photo has been pinned, other users can add comments to the image, providing further depth and context. Historypin allows you to present research visually and can also be used as a research tool itself, providing a repository of photographs and personal memories that can be used to reconstruct the history of place. Images can also easily be shared through over 200 social media channels, including Facebook, Twitter, Pinterest, Blogger and WordPress.
Pins can be grouped in a variety of ways. Collections of photographs are linked by theme, subject, date or any other way the user wishes, giving a specific context to a group of images. Curated by University of Melbourne Archives (UMA), “A Conversation with Penguins” shows rare photographs from the 1910–1913 British Antarctic expedition. Tours allow pinners to arrange their pins in a specific order to provide a visual narrative of a place, event or period. The March on Washington takes the viewer on the civil rights rally in August 1963 around Washington, DC.
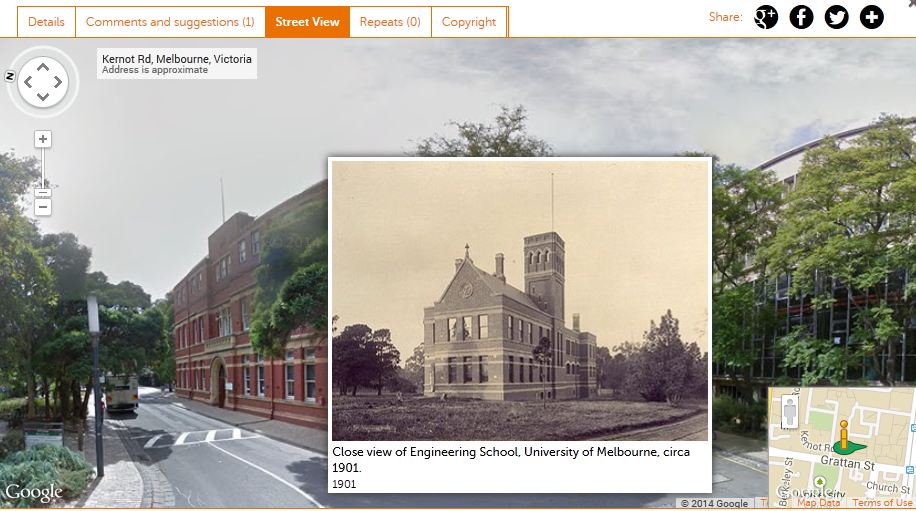
The Streetview feature allows you to overlay images on Google Maps’ streetview, blurring the line between the past and the present. The process can be somewhat time consuming and can only be used where Google Maps Streetview is available, so there are some limitations. UMA Historypin profile shows the original School of Engineering in its contemporary surroundings.
Historypin runs community workshops based around oral history projects. You can apply to coordinate your own research project or approach an institution to work collaboratively. The ‘Changes Places: Yarra Ranges’ Main Streets project was led by Yarra Ranges Regional Museum, highlighting the history of the Yarra Ranges region and fostering local identity, creating on ongoing educational resource.
With over 56,000 users, and just over 18,000 institutions such as libraries, archives, museums, historical societies and schools contributing, Historypin’s audience is growing. Always remember to consider copyright and supply or follow the correct attribution information.
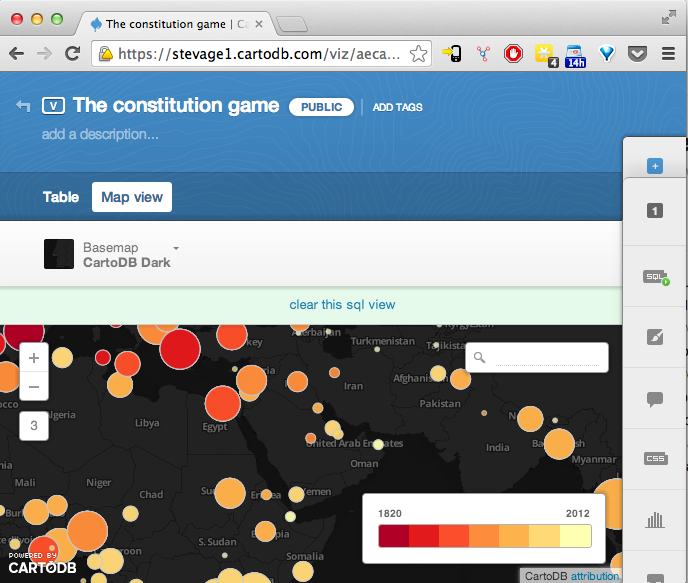
CartoDB
A great place to start visualising data on a map is CartoDB. Free for small maps, it lets you upload spreadsheets or other data, choose a visualisation type (bubble, category, intensity) and get an immediate result. You can tweak the visualisation’s colours, add custom marker images, and even write your own styling code in CartoCSS for advanced visualisations. Built in tools for geocoding (converting addresses to locations) and map embedding make it a great all-in-one platform, but you may find yourself reaching the limits of the free plan – and then it gets expensive.
Strengths: Quick results for “clickable dots on a map”; dozens of basemaps to choose from; all data can be filtered and queried using SQL; generally easy to use; add up to 4 layers; easy to share and embed in blogs
Weaknesses: Big files don’t work well; many small bugs; account limits are quite restrictive, especially for geocoding; not great for print publishing.
Costs: A small research project would probably just squeeze into the “free” category, then it’s at least $29/month for more data, map views, and geocoding credits. ITS Research is investigating providing CartoDB as a free service.
TileMill
MapBox’s TileMill is a pretty amazing cartography studio. It’s easy to use, and is ideal for making customised maps from a variety of data sources, such as shapefiles for government-provided boundaries, OpenStreetMap for roads, rivers, and placenames, and your own CSV files exported from Excel. You have complete control of how each element is rendered, such as the colour, weight, smoothness, dashing, opacity, down to sophisticated rules for avoiding text labels clashing with each other.
The flipside of power is complexity. You can write styling rules in the CartoCSS language, which is well designed and similar to CSS used in web programming, but it will take a few hours for you to really get the hang of it.

Strengths: full control over the entire map; easily combine dozens of different data sources in many formats; great filtering and zoom-sensitive controls for making web apps; pretty easy to use for its power.
Weaknesses: no data editing; no geocoding; limited interactivity features; no wizards; no basemaps; limited support for print formats (no paper metrics like inches, DPI etc); importing data requires first putting it somewhere on the web.
Costs: TileMill itself is a free, open-source download and you can use whatever you produce without royalties. ITS Research Services is in the process of providing free access to a hosted version: please get in touch.
Map Authoring
If you need to create map data from scratch, try one of these tools:
- Google MapsEngine Lite is a fairly powerful platform for creating map-based data: that is, drawing points, lines and polygons on a map, rather than uploading a spreadsheet in full.
- geojson.io is a lightweight platform for authoring map features (like MapsEngine Lite) and works very well with TileMill.
ITS Research provides workshops on TileMill and CartoDB (incorporating geojson.io) under the Research Bazaar banner. They are two great web-based tools that let you turn your research data into impressive maps that you can share with people on blogs, in presentations or in print.
The Library’s Map collection staff (located in the ERC) also can assist with geographic information system (GIS) resources.
Andrea Hurt (Client Services & Liaison Librarian, Arts), Ben Kreunen (University Digitisation Centre), Jane Beattie (University of Melbourne Archives) and Steve Bennett (Information Technology Services).
Leave a Reply