Resources for colours in research outputs
Welcome!
Thanks for joining us at HADES today. Our speakers today are Amanda Belton and Usha Nata from Melbourne Data Analytics Platform. They are excited to be talking about colours in visual research outputs that include cartography, data visualisations and information designs. If you want to dig into some colourful context here is their curated selection of resources and references. Go forth in colour!
Resources
Make visualisations without code for non-sensitive data
Make a colour palette from a picture:
Find an icon to make use of marks along with colour channels:
Make the most of Brewer’s research into colour palettes for maps:
Learn about Plutchnik’s wheel of emotions:
Geographic Information Systems and Cartography, PressBooks Open Publishing
Data visualisation society’s visual accessibility resources
Colour blindness simulator:
Unicef’s website with the patchwork kingdom interactive data visualisation:
and Nadiah Bremer’s design block on her work with Unicef:
Further reading
Barone, E., Forrest, J., & Sontoro, C. (2023). Visual Accessibility Resources. Nightingale. https://nightingaledvs.com/visual-accessibility-resources/
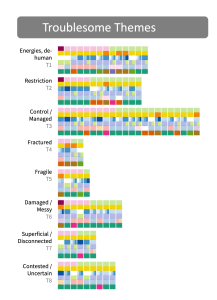
Belton, A., Selkrig, M., Keamy, R., McDonough, S., & Brandenburg, R. (2022). Responses by Theme for Troublesome with Respondent Demographic details. University of Melbourne. https://doi.org/10.26188/20499657
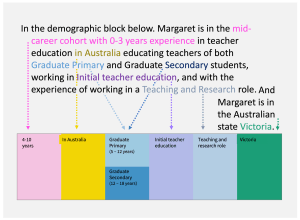
Belton, A. (2023). Example demographic block for bar chart quilt (Version 1). University of Melbourne. https://doi.org/10.26188/23651313.v1
Cairo, A. (2019). How charts lie : getting smarter about visual information / Alberto Cairo. W.W. Norton & Company.
Graze, M., & Schwabish, J. (2023). Building colorpalettes in your data visualization style guides. Journal of the American Medical Informatics Association, ocad084. https://doi.org/10.1093/jamia/ocad084
Munzner, T. (2014). Visualization Analysis and Design [electronic resource] / Munzner, Tamara. A K Peters/CRC Press.
Segel, E., and J. Heer. (2010) Narrative Visualization: Telling Stories with Data.” IEEE Transactions on Visualization and Computer Graphics 16.6
Categories