The Commercial Travellers Association: Plotting an Image of Australia
Cat Gay is a PhD candidate in the University of Melbourne’s School of Historical and Philosophical Studies. Her thesis is entitled ‘All life and usefulness’: Girls in nineteenth-century Victoria’.
The above map plots the location of each digitised photograph in the Commercial Travellers Association of Victoria (CTA) archive, held at the University of Melbourne Archives (UMA). Created through Carto, the map provides a spatial and temporal overview of the 1,203 photographs in the collection. As an historian, a means of simultaneously analysing date and location plays into my discipline’s insatiable interest in change over time; with the digital map making it possible to plot patterns of typicality or indications of rupture, shifting agendas, progression and regression.
Many of the images in the collection were included in the CTA’s publication Australia Today, distributed to CTA members overseas to entice suitable migrants to Australia from 1905 to 1976. During its time, the CTA’s compilated distribution of images of the settler-colonial nation, therefore, held a persuasive purpose. This digital map however presents the photographs as a montage of locales, building a cumulative picture of a highly urbanised, coastal based nation. Taken between 1919-1961, the map groups the photographs by decade, which allows a visualisation of the ways in which the CTA’s representation of Australia did, or did not, change over time. As seen in the brief analysis below, striking patterns emerge by looking at each decade.
1919-1920
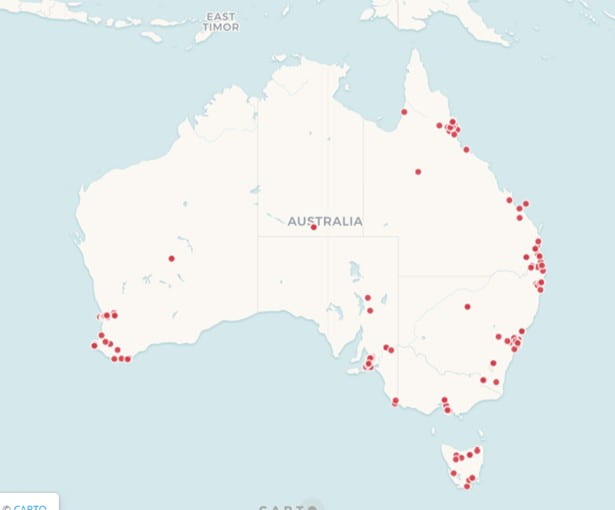
The photographs from 1919-1921 cluster around Australia’s coast and capital cities. Australia’s interior, the vast expanse of desert inhabited by indigenous Australians, remains untouched – the furthest venture inland is to Leigh Creek, South Australia. (The other further inland points are images that had no specified location apart from the state).
1930-1939

The largest percentage of photographs appear in the 1930’s, and aggregate a similar image to the 1920s, but with more concentrated clusters emerging around Sydney, Brisbane, Cairns and Perth. The farming districts of NSW, SA and WA appear with more frequency; as the interior becomes slowly encroached upon by agriculture and settlement.
1940-1949
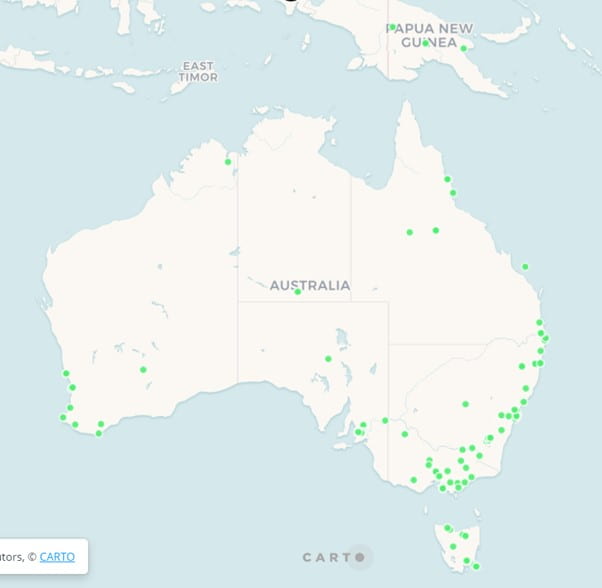
Fewer points on the map appear in the 1940s, the period of the second World War, yet there is a distinct pattern of documenting the south east of Australia; and a line of locations within Tasmania, Victoria and the coast of NSW form a curved trajectory, perhaps the well-trodden paths of the travelling salesman during this time. The images appear to have retreated back to the coast, leaving Australia’s inland once again without representation or interference. Interestingly, given Australia’s involvement during the war, three locations are recorded in Papua New Guinea.
1950-1961
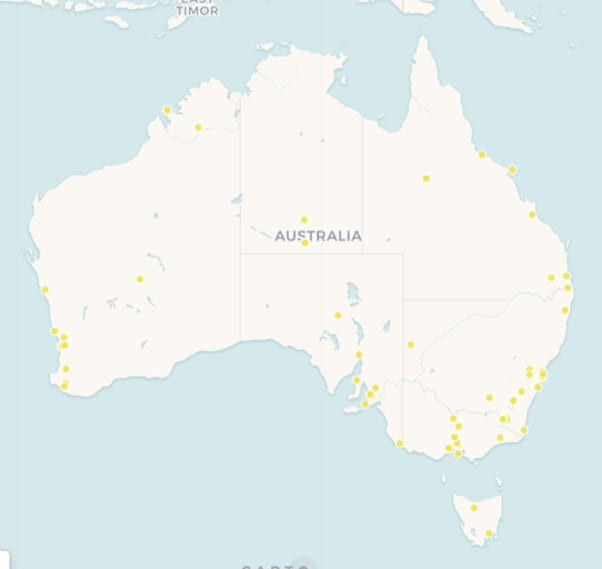
From 1950-1961, whilst the points are fewer and sparser, photographs of cities and surrounds are distributed widely across the map including in the north of Western Australia.
Conclusions
Taken as a whole, from 1919-1961, the map portrays the activity of commercial travellers as clusters along the east coast of Australia (Tasmania, Victoria, NSW and QLD), Adelaide, and the south-west (south of Perth), reflecting Australia’s reality as an urbanised, coastal nation. Whilst images of the bush or rural localities do appear frequently in the collection as the following blog entries will show, they are often images close to state capitals or to the coast, within reach of what was regarded as “civilisation” for the white entrepreneurial men of the CTA. The CTA photographs therefore aim, as did their journal, to persuade the potential visitor or migrant of a map that conveys Australia as one of coastal scenery, wooded landscapes, and rural terrain but all within a reasonable distance from rapidly-developing, modern cities.
Methodology:
To create this map, I took the metadata excel spreadsheet, provided by UMA, and saved it as a CSV file. I retained and retitled the columns to focus on markers for the digital map. These variables were: Identification (the number used by the UMA to identify each individual photograph); Title; Location; Date; Year; Latest Year; and URL.
I extracted each entries’ location data (place, city, state) into the ‘Location’ column, from information provided in the UMA’s title and/or the description, which was included in the original metadata spreadsheet. The exact location, if given in the title or description, was used, although this was challenging as many of the titles or descriptions did not give clear location information. If the existing data was vague, the nearest town, state or even just ‘Australia’ was added to the ‘Location’ column. This information could be ascertained from the photographer (sometimes mentioned in the UMA’s description), with similar photographs taken on the same date, or by looking at contents of the photograph itself.
Another issue in ascertaining location was the perspective of the photograph. Should the location be what the photograph is of, or where the photograph was taken from? I decided that if a photograph was taken of a discrete thing or place (e.g. Mount Barker, or Government House) I included this as the location. If the photograph’s vantage point/perspective is specified and the subject is vague, such as ‘Scene of the city of Adelaide from North Terrace’, the location ‘North Terrace, Adelaide, SA’ was used.
A geolocation plug-in, an add-on in Google Sheets, extracted latitude and longitude from the location data. I also extracted date data and simplified it to year, rather than d-m-y format. This is to trace change over time, as the photographs span 1919 to the 1960s. The metadata for each decade was then saved in four separate CSV files. I then uploaded the four files to Carto, which plotted the locations (from the lat-long data) for each of the 1,203 items on a digital map. The four CVS files have created four layers on the map, for the roughly four decades spanned by the photographs: 1919-1929; 1930-1939; 1940-1949; 1950-1961. Each layer has been given a different colour, highlighting photograph location patterns over the decades. Each point can be clicked on to reveal the UMA Identifier, UMA title, location, date, and URL to the UMA online catalogue entry.
Great post!Check best Study Abroad blog
Dear Cat,
Thanks for a fascinating study. I came across it when working on the CTA collection for our platform TLCMap (tlcmap.org), in collaboration with Rachel Fensham. I have put a small subset of the photos onto the platform as a sample project to explore the idea of making an online window to the set. However, I see you have found lat and long for the whole set, no mean feat . . . If you wanted, you could upload the whole set to TLCMap (under your own name) to make it accessible for anyone, including URLs so users could see the photos if they wished. Get in touch if this is of interest — hugh.craig@newcastle.edu.au.
In any case, congratulations on the project and
Best wishes,
Hugh Craig.