How to report P-values
You will routinely find P-values in the output of statistical software. How should they be reported?
An example
If you’ve suffered from motion sickness, you might have taken a medication (such as “Kwells”) based hyoscine hydrobromide.
In the early 20th century, the effect of hyoscine hydrobromide on sleep was investigated. In his original paper deriving the t-distribution, Student illustrated his methods using data from a study looking at the gain in hours of sleep after using various forms of hyoscine hydrobromide. Here is a dotplot of the hours gained when the patients used a particular form – Laevo-hyoscine hydrobromide. The measurement is the hours gained – the difference between using Laevo-hyoscine hydrobromide and not using it.

Here we consider carrying out a single sample t-test of the null hypothesis that the true mean hours gained was zero.
Some output
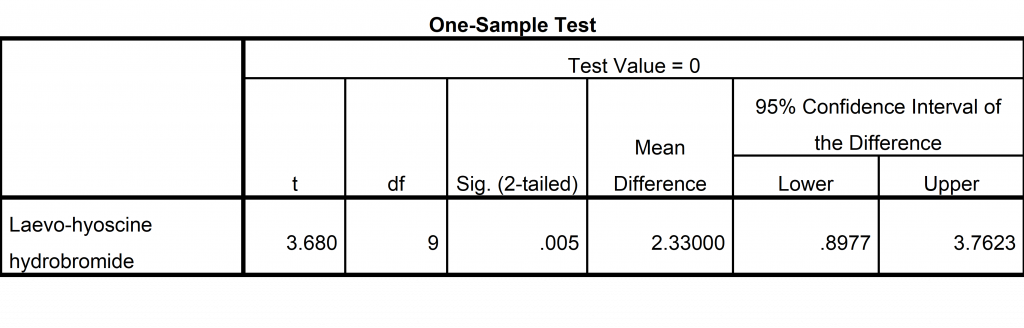
Here are the results from various software pages.
R

Minitab

SPSS
How you might see the results reported, none of which are recommended
- P = 0.0050706
- Too many decimal places!
- 0.005 in a table labelled “Sig.”
- It’s the P-value, not “Sig.”
- P < 0.05
- That’s only the ball park – the value in relation to an arbitrary threshold.
- Using the “star” system, and indicating that the result is less by 0.01 by using **.
- Again, that’s only the ball park.
- Stating that the result is statistically significant.
- That’s the implied ball park! That only has implied numerical meaning.
How to report P-values
- If you are reporting P-values in an academic paper or thesis, it’s good practice to report the actual value to three decimal places.
- If the P-value is very small, common practice is to report it as P < 0.001.
- It’s not sufficient to only report a P-value; relevant estimates and confidence intervals should also be provided.
For example, patients gained an average of 2.3 hours of sleep when using Laevo-hyoscine hydrobromide, with a 95% confidence interval of 0.9 to 3.8 hours. The P-value for a test of the null hypothesis that the true average gain was zero hours was P = 0.005.
Student’s paper
Student (1908) The probable error of the mean. Biometrika, 6, 1-25.