What is a confidence interval?
Confidence intervals appear in reports of statistical analysis, academic papers and sometimes in mainstream media. They might be reported in text, or presented in a graph.
A confidence interval is calculated from sample data, and is reported alongside an estimate of a population parameter.
An example
This example is from a study of the use of a smart bracelet for recording the physical activity of patients who had cardiac surgery. The main outcome of interest was the number of daily steps, measured 60 days after surgery. The study also looked at the feasibility of using the device.
The reference for the study is:
Hauguel-Moreau, M., Naudin, C., N’Guyen, L., Squara, P., Rosencher, J., Makowski, S., & Beverelli, F. (2020). Smart bracelet to assess physical activity after cardiac surgery: A prospective study. PloS one, 15(12), e0241368.
The data for 100 patients who were able to use the device is available from Dryad: https://doi.org/10.5061/dryad.547d7wm6m
The population parameter of interest is the true mean number of steps at day 60. We use the sample mean to estimate this.
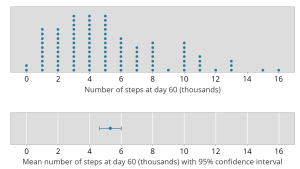
The top panel of the graph below shows the data for the 100 patients.
The bottom panel shows the 95% confidence interval for the mean number of steps at day 60. The dot in the middle is the estimated mean number of steps at day 60 (5.3 thousand). The bars show the 95% confidence interval ranging from 4.6 to 6.0 thousand steps.
How do we think about the confidence interval?
The mean of the sample is our ‘best’ estimate of the population mean. However the data could plausibly arise from a population with a different mean. The sample data look consistent with a population mean of 5.2 thousand or 5.4 thousand, for example. We would not, however, consider the sample data consistent with a population mean of 20 thousand, or one thousand, for that matter.
The 95% confidence interval provides the set of of values for the parameter of interest with which the data are consistent. In this case, it’s the set of values for the true mean number of steps at day 60 following cardiac surgery: 4.6 to 6.0 thousand steps
The confidence interval provides an indication of the precision of the estimate of a population parameter. In our example, the width of the 95% confidence interval is 1.4 thousand steps (6.0 minus 4.6). A narrow confidence interval is considered more precise than a wide confidence interval, in the sense that it covers a smaller set of of values.
What influences confidence interval width?
The width of a 95% confidence interval for the mean depends on the variability in the data and also the number of observations (sample size). In our example, the sample size is 100. If the sample size was smaller, we would expect the 95% confidence interval to be wider.
In general, confidence interval width will depend on sample size, along with some other features of the data. In general, larger samples lead to narrower confidence intervals relative to smaller samples.
The margin of error
Many but not all confidence intervals are symmetric around the estimate. In our example, the estimate of the mean is in the middle of the confidence interval – the interval is symmetric. The distance from the estimate to the lower bound is the same as the distance from the estimate to the upper bound. This distance is half the width of the 95% confidence interval, and is referred to as the margin of error.
The bounds of the 95% confidence interval and the margin of error for our example are shown below.
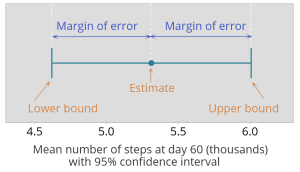
You may be familiar with the margin of error in reports of polling. If you have an estimate and a margin of error, you can work out the 95% confidence interval.
The confidence coefficient
Most confidence intervals you will come across are 95% confidence intervals.
95% refers to the confidence coefficient or confidence level.
The confidence coefficient is decided a priori, with statistical convention to set it at 95%.
What does ‘95%’ mean?
95% corresponds to a probability of 0.95.
To understand this, we need a thought experiment or a simulation. Formally, 0.95 is the long run probability of the true value of the parameter falling inside the 95% confidence interval.
Imagine repeating a study many, many times with the same sample size. Sometimes the set of values in the confidence interval will include the true value, sometimes it will not. In the long run, 95% of confidence intervals will contain the true value. Of course, we need to be omnipotent to know which ones they are!
This is why a simulation can be useful. Here’s an example. Let’s assume that the true mean number of steps at day 60 is 5.5 thousands. We can simulate carrying out 100 different studies, like the one in our example, and work out a 95% confidence interval in each case. They are shown in the plot below. There are 100 different confidence intervals. In the plot, we can see that in most cases the set of values defining the confidence interval includes the value of 5.5 (the true mean). There are a small number of confidence intervals that don’t include the value of 5.5 – they are shown in red. In fact, in this simulation, 95 of the 100 intervals include the true mean, and 5 do not. If we ran another simulation, we might get a different result, but if we ran the simulation for long enough, 95% of the intervals would include the true mean. This is what is meant by the long run probability. (This is a frequentist interpretation of confidence intervals.)
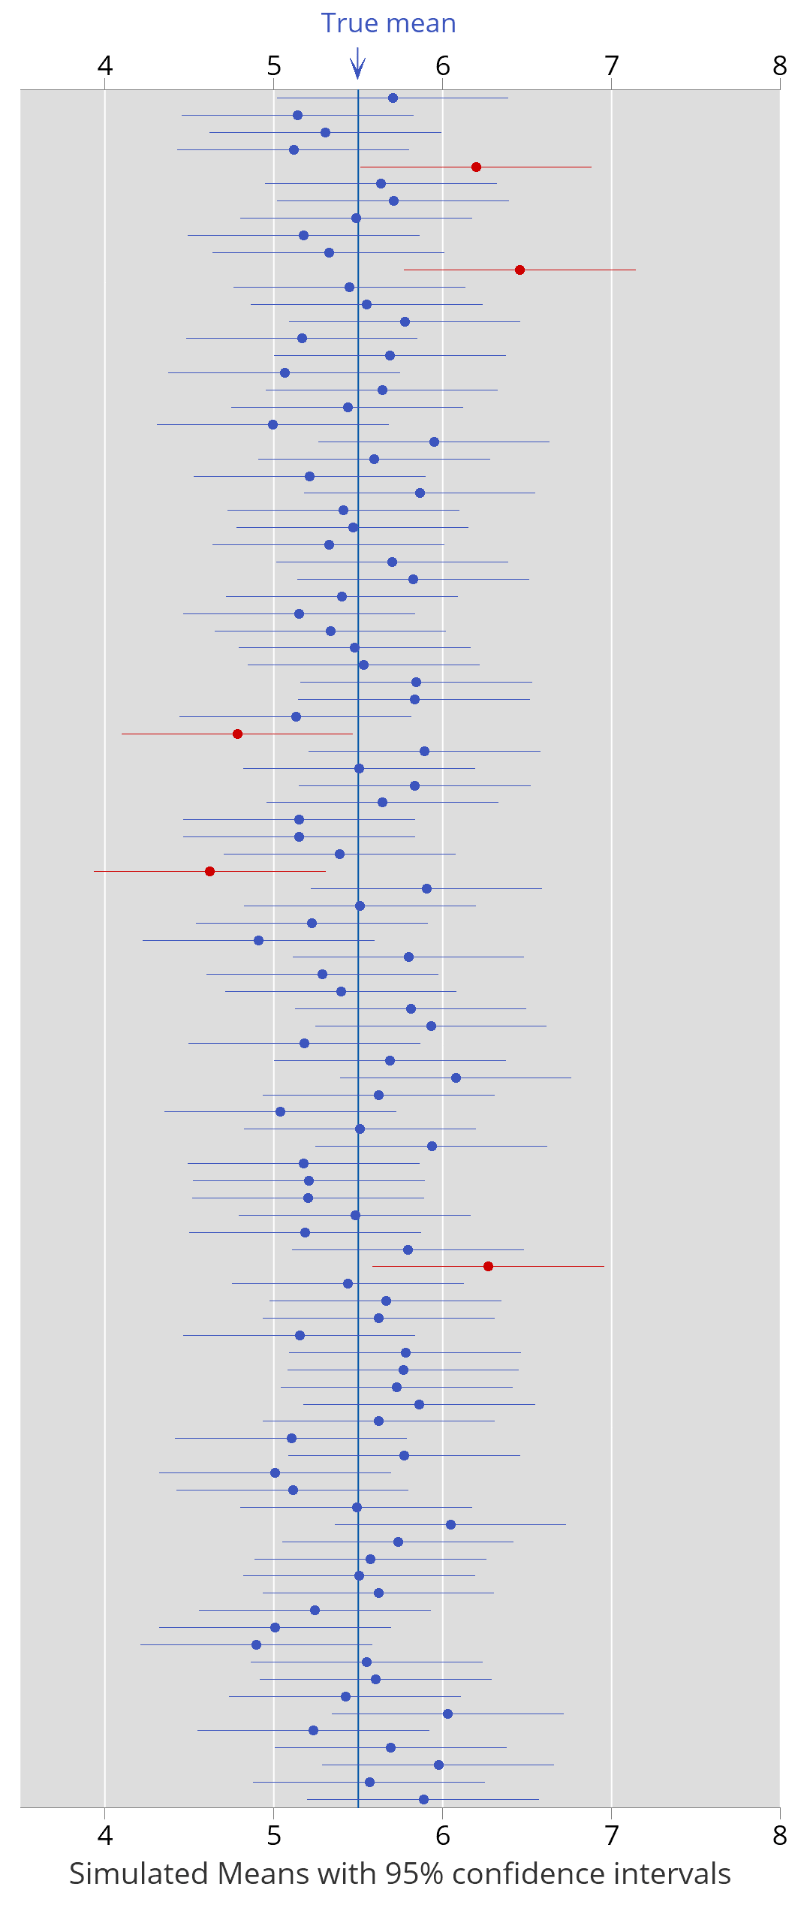
Remember – this is a simulation. It allows us to see what happens when we assume we know the true population mean – of course, that is not the case in practice.
(There are some technical details and other assumptions behind this simulation, which we won’t go into here.)
Some ways the confidence interval is misunderstood
The conceptual basis of confidence intervals can be tricky to understand. Here are some common misconceptions, including some discussed in:
Greenland, S., Senn, S. J., Rothman, K. J., Carlin, J. B., Poole, C., Goodman, S. N., & Altman, D. G. (2016). Statistical tests, P values, confidence intervals, and power: a guide to misinterpretations. European Journal of Epidemiology, 31, 337-350.
Misconception: A confidence interval describes the range of data.
In our first figure, you can see that the range of the data is from 0 to 16 thousand steps. The 95% confidence interval is from 4.6 to 6.0 thousand steps. It’s clear that the confidence interval does not describe the range of the data.
Imagine sampling say 100 more patients and adding them to our data. We don’t expect the range of the data to change much. But we do expect the 95% confidence interval to become narrower.
The confidence interval does not describe the range of data.
Misconception: The confidence coefficient is the probability that the true value of the parameter falls inside a particular interval.
The confidence coefficient is a long run probability, as discussed above.
When we have a single observed interval, as in our example, the true value is either in the set or outside the set. But we don’t know.
The confidence coefficient is not the probability that the true value falls inside a particular interval.
Misconception: The confidence coefficient is the probability that the sample estimate falls inside a particular interval.
The confidence interval is built on the sample estimate; it’s always inside the interval. (Revisit the second figure above.)
Misconception: A single observed 95% confidence interval will include 95% of the estimates from future studies.
Consider the simulation above. Assume we had observed the last red interval in our study. It’s clear that many of the subsequent estimates (means) fall outside this particular interval.
A single observed 95% confidence interval does not predict where 95% of the estimates from future studies.
Misuse
The mean number of steps at day 60 post cardiac surgery was 5.3 thousand, with a 95% confidence interval from 4.6 to 6.0 thousand. The applied interpretation of this estimate and confidence interval requires clinical knowledge about the population of interest and the aims for recovery post surgery.
Confidence intervals are sometimes used to carry out a hypothesis test, and misconceptions about P-values lead to analogous misconceptions about confidence intervals. You can read more about this in Greenland et al. (2016).
A confidence interval should not be used solely to carry out a hypothesis test.